

An active product that can demonstrate a structural or repeatable element to its performance is indicative of skilled investment decisions, while one that cannot is merely indicative of good luck. In this article we point to a couple of key ideas which are important in making that assessment.
There are a number of different ways to invest, falling along a spectrum from passive to active. At the passive end, a product issuer provides an investor with passive exposure by replicating an index. At the active end, a product issuer provides a highly concentrated product which has unique ideas expressed in a different way to any benchmark. Typically both of these management styles (and all those that fall in between) are assessed based on their relative performance, however at the active end of the spectrum there is much to be assessed beyond the headline numbers.
A key idea in separating raw performance from structural performance is that of intended versus unintended bets: is a manager consistently seeing performance in the parts of their portfolio where they expected it, or elsewhere? A second key idea which ties in with the first is repeatability, or whether this intended part of performance is repeatable over time. In order to assess these elements the intention of the manager needs to be known, or at least their broad investment philosophy, which should be accompanied by an economic rationale as to why the philosophy should work.
In our case, we have a simple investment philosophy: we believe that ultimately the economics of a business model drive long-term investment returns. Companies who are in the growth phase of their lifecycle, with long runways ahead of them, who are capital-light and display an enduring or strengthening competitive advantage, are better investments than others. It follows that only companies meeting this investment criteria will be deemed investable and form the basis of our portfolios. Further, as we are interested in long-term returns they will be included in our portfolios for a long period of time.
When assessing how we deliver returns, one would expect that, given our stated philosophy and process, the majority of our alpha should be generated through stock selection as opposed to sector selection, factor exposures, currency or market timing. What is important however, is assessing if the expected return drivers match up with the delivered return drivers.
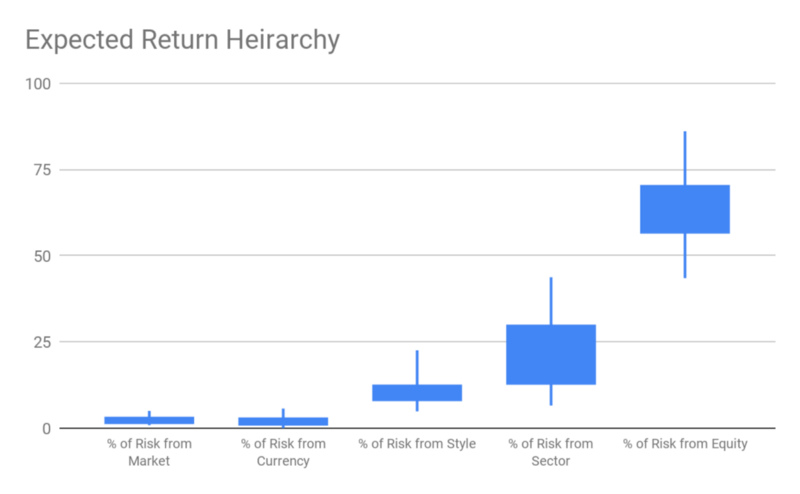
As an example, the below figure highlights the ex-ante tracking error decomposition of our Growth Companies Strategy. It shows that we expect to generate the bulk of our returns through stock selection. Of secondary importance is sector selection [note: this is really is just a by-product of our stock selection] and factor exposures. Alpha generation attributed to market timing and currency is expected to be almost negligible.
Over the last six months or so, market commentators have focused their attention on rising interest rates and inflationary expectations (See our recent article discussing the wealth management platforms). This environment is not generally supportive for growth managers, as their positions tend to trade at higher near term multiples because they capitalise longer dated potential future earnings; an increase in interest rates impacts the current valuations of these stocks through a corresponding rise in the discount rate applied to the forecast earnings. As a result, most people would believe that all else being equal, as a growth manager we should underperform in this environment.
However, this assertion presupposes that the majority of our alpha generation comes from our factor exposures. While we will absolutely face headwinds, style factors only contribute less than 20% to our expected alpha generation on average [See Figure. 1]. Our expectation is that we will continue to generate returns from better than expected continued growth in earnings in spite of an increase in interest rates, driven by the quality of the business and the management talent.
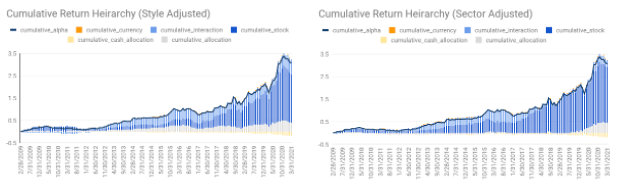
Decomposing our historical alpha generation demonstrates the link between our expectations, and what we delivered. In Figure 2 below, stock selection [the dark blue] drove ~90% of our alpha generation over the last decade when adjusting for sector exposures, and ~70% of our alpha generation when adjusting for style factors over the same period. This mirrors what we were expecting in Figure. 1 above.
Understanding a manager’s philosophy and the way they translate that into an investment strategy should provide enough information to assess the skill of the manager. Finding one who has been able to not only deliver long-term investment performance is important, but finding one who is able to articulate how they have generated that performance is critical.
We believe that the only way to grow wealth that is resilient and sustainable, is to invest money in a careful, considered and committed way. Our Investment Philosophy leads into our investment strategy which informs the way we construct portfolios. This approach not only allows us to articulate where we take risk and why, but allows us to articulate how we’ve delivered the results for our clients over time.
While this may be seen as talking our own book, we believe that as managers it is incumbent on us to be able to articulate these things. Not only to demonstrate whether or not we exhibit a degree of skill in our investment decision making, but also that our clients can understand more fully what they are buying into when they invest with us.
The article has been prepared by ECP Asset Management Pty Ltd (ECP). ECP is a funds management firm based in Sydney, Australia. For further information, visit www.ecpam.com. This material has been prepared for informational purposes only, and is not intended to provide, and should not be relied on for financial advice. ECP and the analyst own shares in IDP Education. ABN 26 158 827 582, AFSL 421704, CAR 441986.
Featured Articles


